After a few years of MLT-2 enjoying a well-deserved retirement, I received a query regarding a user’s inability to use the MLT-2 MS Access version in 64-bit systems. My first impression was to be flattered that someone was still using it. Then I started looking into the problem.
I had not looked at the MS Access VBA code in years, so I first responded that everything should work, since I am able to run the program just fine in my 64-bit Windows 10 machine. It wasn’t until later that I realized my error. Despite Microsoft stating the MS Office installs in 64-bit by default, I was running the 32-bit version of Office in my MS Access development machine. So, after correcting that, I was able to replicate the 64-bit error.
After a few hours of tweaking the code to VBA 7 and testing, I had a new version of MLT-2. Along the way, I decided to also ditch the whole subscription model, but keep the expiration date on the releases for ease of support. This way, outdated versions don’t linger in the wild.
There are no new features, but the experience of getting back to doing some development, got me motivated to consider some enhancements. So, let me know what you think. The download links for the refreshed 32-bit and 64-bit versions are below.
I have had these in my archives for a while, and the publications might be a bit dated, but I thought I would post them here in case anyone finds them useful.
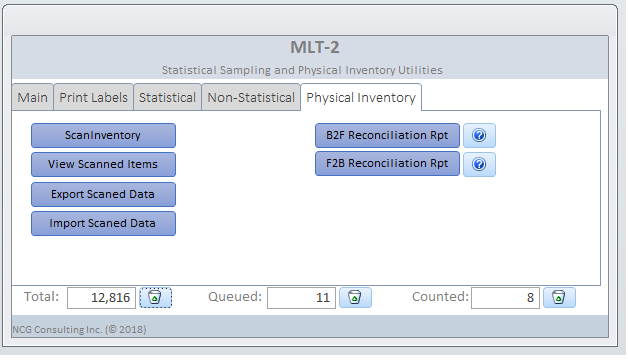
The MLT-2 application had its humble beginnings in 2014 as the “Material Label Tool”; a rudimentary desktop software tool to allow our customer to print mass batches of Navy Enterprise Resource Planning (ERP) barcode labels. That was a functionality that did not exist in Navy ERP and that we thought would be addressed soon enough to prompt us to only develop a quick fix.
Many years later, the labeling functionality was still needed and we were faced with the potential need for an offline barcode scanning physical inventory tool. Therefore, the application evolved into MLT-2 – a full-fledge stand-alone automatic identification technology toolkit.
Over the years, the application has allowed our customer to meet almost insurmountable barcode labeling requirements, supporting the transition of millions of units of material from legacy systems to Navy ERP.
The tool has done its job and, since there is no longer a customer requirement, I have come to the decision to retire the MLT-2 application. Users who are currently using the application will no longer be able to renew their registration once it expires.
For users or organizations looking for a similar tool, and since this patented code is no longer restricted to another set of customer requirements, this might be your opportunity to leverage this work for your own needs. Feel free to contact me to discuss your ideas.
120412-N-UT411-072
INDIAN OCEAN (April 12, 2012) Logistics Specialist Seaman Rennie Gonzalez, assigned to the supply department aboard the Nimitz-class aircraft carrier USS Carl Vinson (CVN 70), conducts an inventory in a storeroom. Carl Vinson and Carrier Air Wing (CVW) 17 are deployed participating in Exercise Malabar 2012 with ships and aircraft from the Indian Navy. (U.S. Navy photo by Mass Communication Specialist Apprentice Andrew K. Haller/Released)
I have been asked about statistical inventory sampling so many times that I felt that I should share my thoughts in an article (or many). In simple terms, statistical sampling is the selection of a subset of items to represent a population and it is a very useful tool for establishing inventory accuracy.
In order for the process to be considered representative, there are a few fundamental rules:
Each item in the population must have an equal chance of being selected (i.e. no targetting or cherry-picking).
The selection of items to sample must be random and free of bias.
The following are some common terms you would encounter: confidence level, sample size, population size, margin of error. The vast majority of the time, the confidence level and margin of error will be dictated to us, as this determines the precision and robustness of our results. A very common set of parameters typical in DoD supply chain policy is 95% confidence level with a +/- 2.5% margin of error.
If talking about confidence levels and margins of error is still fuzzy, fear not, there are tools that make the whole thing practically plug-and-play. I even developed my own spreadsheet calculator in one of my articles on my website (link here).
Note: if you, like me, are “of a certain age” in Navy Logistics terms, you might remember a program called STATMAN that for many years was the Navy’s standard tool for these calculations when dealing with inventory accuracy.
In order to conduct what is called “Simple Random Sampling” there are only a few computations that we need to make: 1) the sample size, and 2) the accuracy results (usually a percentage or ratio). We were going to compute the accuracy anyway regardless of method, so that leaves the sample size as the only new thing we need to figure out. To get the sample size, simply plug the following parameters into the spreadsheet calculator linked in the previous paragraph (or an online tool like this one): 1) population size, 2) confidence level, and 3) margin of error. This will give you the minimum sample size that needs to be collected in order to satisfy the parameters. Select that number of items at random from the population – you can do this manually or using most spreadsheet programs. Then conduct the inventory and compute the accuracy percentage. Whatever percentage you get (e.g. 93%) would be expressed in terms of a “confidence interval”, which is nothing more than stating the margin of error with our results (e.g. 93% +/- 2.5%). That’s it!
Now, like anything, it can get much more complicated. There are sampling strategies that involve stratification, different allocation methods, etc. that are well beyond the scope of this article. Therefore, we will leave things here for now and I hope that you found this article useful.
If you would like to dive a little deeper into the statistics involved in this type of sampling, there is an excellent video in the zedstatistics channel in YouTube titled “What are confidence intervals? Actually” that I highly recommend.
COAN904, Probability Sampling Course, GAO. (Note: sadly, the course no longer appears to be offered externally, but the manual can still be found here)
I found this interesting video on youtube and I thought it was relevant to a lot of other things in addition to computer science. Enjoy:
You might find it amazing how many concepts from computer science and math are applicable to logistics.
One of my early ideas for a doctoral dissertation involved adapting the concepts from Claude Shannon’s The Mathematical Theory of Communication, combined with Jay Wright Forrester’s Industrial Dynamics concepts. For those unfamiliar, Claude Shannon is the father of information theory and Jay Wright Forrester (of Beer Distribution Game fame) was a computer engineer who revolutionized the way we think of and manage supply chains (see bullwhip effect, a.k.a. Forrester effect). The idea for my research was to examine the relationship between information entropy and the performance of a supply chain. However, my advisor was not interested in the idea and I had to start over with something else. Nonetheless, these concepts are very intriguing and still worthy of research, in my opinion. So, if you are interested in collaborating in some research, let me know.
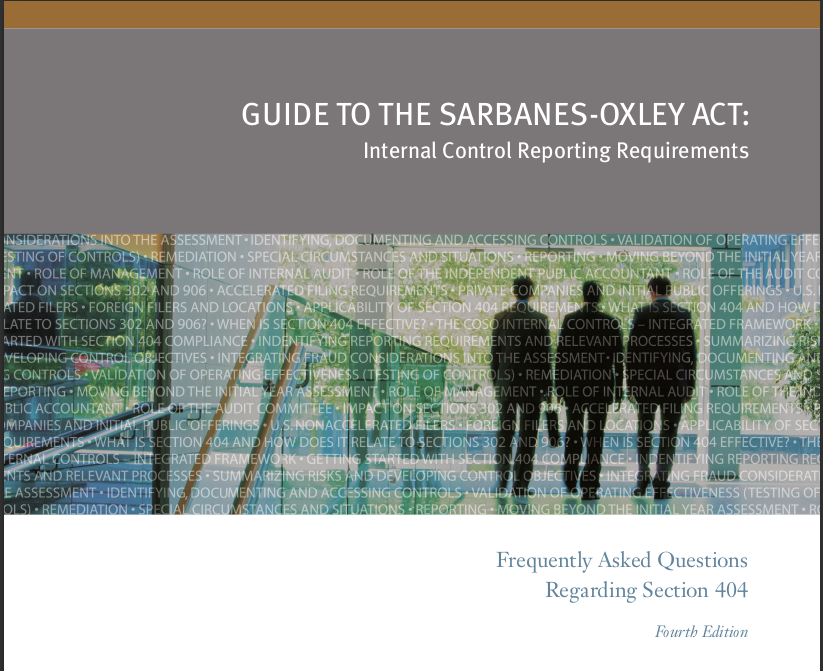
I recently ran into the publication shown in the lead picture to this article and found it fascinating, particularly for those of us involved in the business of inventory management as it relates to financial compliance. The publication is freely available on Protiviti’s web site; link to the download page here.
To provide some very quick background, the Sarbanes-Oxley Act (commonly abbreviated as SOX) is the Federal Law that mandates certain practices in financial record keeping and reporting for corporations. To quote SECNAV’s FIAR Committee: “the federal sector’s version of SOX is the Federal Managers’ Financial Integrity Act of 1982, from which the revised OMB Circular A-123, Appendix A was derived.”
So, now that we have established the background and relationship between SOX and FIAR, what I wanted to highlight is the great importance that SOX gives to physical inventory controls. For example, Protiviti’s guide gives the following as an example of a good description for adequate management controls in compliance with SOX:
“Inventory management personnel periodically conduct cycle counts with an objective of systematically covering the entire inventory over a 12-month period. The cycle-counting process covers all locations. Counts are complete. The physical counts are posted immediately to the perpetual records and compared to recorded amounts. Any differences noted are used to process an adjustment to the general ledger. The plant controller approves the adjustment. Significant book-to-physical adjustments, as identified by the plant controller, are investigated to determine the items causing the adjustment and the root causes so that appropriate process improvements can be made.”
Sounds familiar? Reading that paragraph reassured me that, with the current direction in policies, we are likely on track to achieve audit readiness at DoD, provided that we execute on those policies.
Here is another paragraph from that publication discussing how physical inventory, as a management control, is used to mitigate audit risk:
“Controls that have the most direct impact on mitigating a risk and achieving an assertion that the company is controlling the flow of financial reporting transactions and information. These are the controls that management and process owners would agree are the company’s “primary line of defense” to reducing a risk of a material misstatement to an acceptable level and achieving a higher risk financial reporting assertion. Thus, they are the controls that the company looks at first to ensure they are operating effectively before considering all other controls. An example is the use of management approvals to address the risk of unauthorized transactions. Another example is the use of wall-to-wall physical inventories or periodic cycle counting to satisfy the “existence of inventory” assertion. Still another consideration is the proximity of a control to the point within a critical process at which there is a reasonable possibility errors or fraud could occur.” (Highlight is mine)
I just wanted to share this to show how physical inventory management is indeed a key component to audit readiness, and recognized as such at the highest levels. If you are able to read the full document (though it is long and kind of dense), I highly recommend it.
Throughout my career, I have been fighting a losing battle. Unfortunately, I am usually well in the minority or alone in my position and I have to let things go in the interest of progress.
The issue is that of standards. It saddens me to say that in my 40 year career in DoD logistics I have met very few logisticians who understand the difference between a standard and a policy. A lot of this has to do with how standards are constantly misused and taken advantage of.
In DoD, the central agency responsible for the management and control of standards is the Defense Standardization Program Office. They publish the Defense Standardization Program (DSP) Procedures manual, DoDM 4120.24, attached to this article. As defined in that manual, a standard is “a document that establishes uniform engineering or technical criteria, methods, processes, and practices.” The reader should notice the absence of the words policy, procedures, guidance, or mandate.
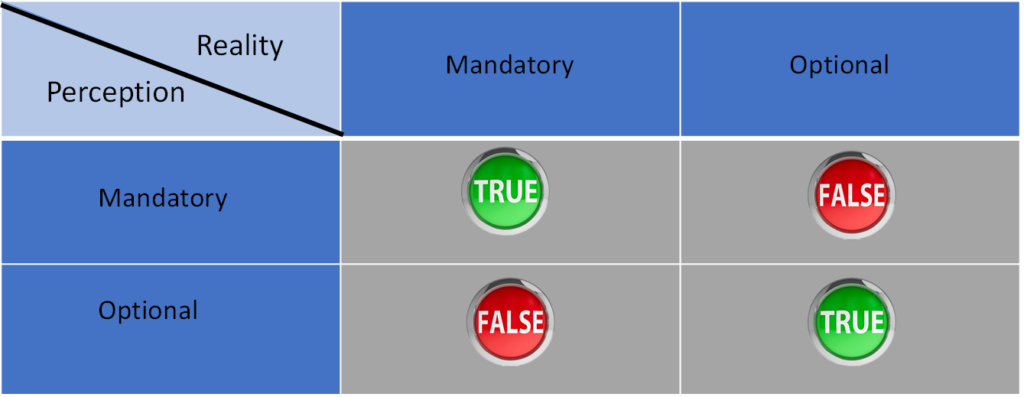
By far, the most common misconception I see is when someone makes the statement that something must be done in order to “comply” with a standard, such as MIL-STD-129 for labeling and marking of material or MIL-STD 1916 for statistical sampling. What makes a standard, or parts of a standard, mandatory is a policy that prescribes the standard, not the standard itself.
One example I give, often unsuccessfully, to those who are confused is to explain how today we have standards for both metric and imperial units; however, we have ordnance that is specified in metric (i.e. 9mm pistol) and others in imperial units (i.e. 2,000 lb bomb) but neither is in “non-compliance” of the other standard. In that case, the program manager of each respective program decided (in accordance with DoDM 4120.24) which standard is more appropriate in order to maintain commonality within their program.
So, if you are reading this, please consider reading the attached document and help reduce the standards confusion.
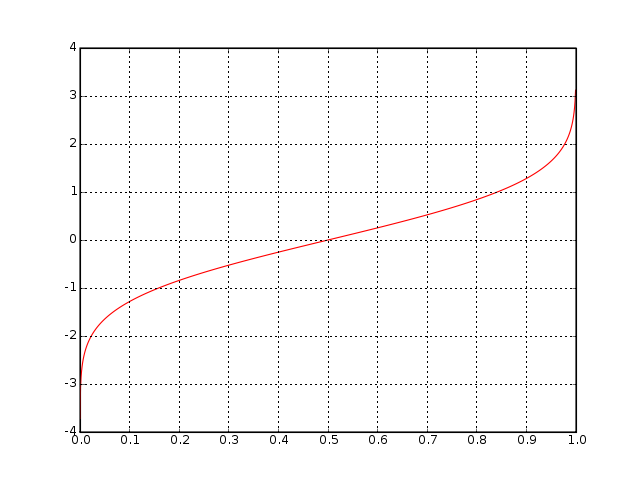
This is a follow-up to my previous post where I detailed my adventures trying to implement in Visual Basic .NET the Inverse Normal Cumulative Distribution Formula (a.k.a. NORMSINV).
As I mentioned in that post, I had been looking for a way to implement the NORMSINV function into a .NET application. I explained how I adapted Peter Acklam’s algorithm for which I adapted some C++ code that I found on the Internet into my .NET application. Later I found that others had done adaptations for various other languages including C#.
Sadly, though Acklam’s algorithm worked well, I could not get the function to match precision closely enough to my legacy program that I was replacing.
Peter Aklam never published his algorithm in any peer-reviewed journals so, other than some historical web pages, it was not possible to follow up to see if any changes or progress took place. However, those historical pages pointed me to the previous work of others.
Conducting that literature research, I found the seminal paper “Algorithm AS 241: The Percentage Points of the Normal Distribution” by Michael J. Wichura (1988), Applied Statistics, vol. 37, pp. 477-484. This paper included an implementation of a function “to compute the percentage point zp of the standard normal distribution corresponding to a prescribed value p for the lower tail area” in FORTRAN. Wichura’s algorithm itself extends previous work by Beasley, J. D. and Springer, S. G. (1977), “The percentage points of the normal distribution”, Applied Statistics, vol. 26, pp. 118-121, which introduced the function PPND (Percentage Points of the Normal Distribution) as part of algorithm AS 111, also published in FORTRAN.
After a quick crash-course in FORTRAN syntax, I was able to easily (but tediously) translate Wichura’s algorithm to Visual Basic .NET. Wichura published two versions of the algorithm in his paper. I only adapted the double-precision function called PPND16 that you can freely download from my github repository.
Since Wichura’s code is published work and all I did was essentially translate it, I am not making any claims to this code other than as a humble contributor. Please feel free to copy or modify it and I hope you find it beneficial.
(Note: Support for MLT-2 will end on 30 September 2022)
This past Summer we conducted a series of statistical sampling inventories, which caused me to take a look at the Material Label Tool as a starting point for that project. I added some statistical sampling functionality and actually started calling it STATMAN II because it incorporated many of the features of the original STATMAN.
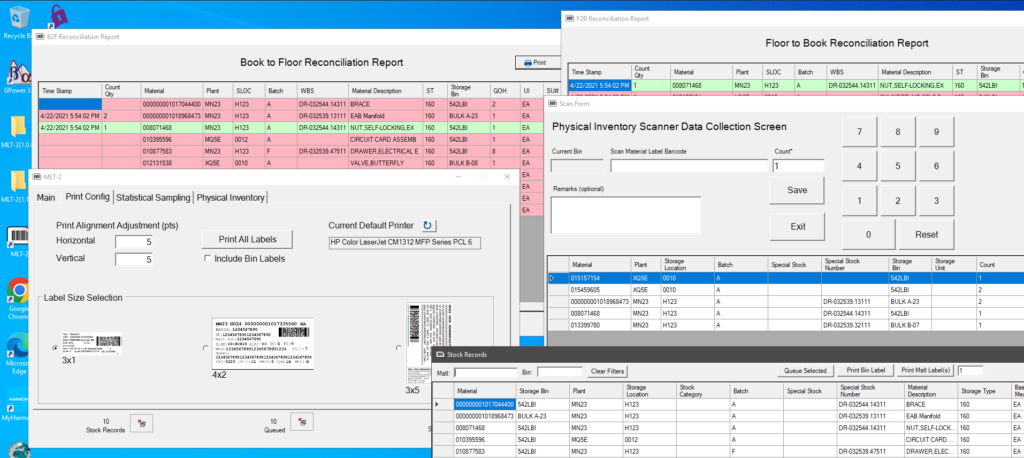
So I have decided to fully evolve the tool into a complete physical inventory data collection utility with full scanning and parsing capability of Navy ERP material labels.
Now that the application is done, I decided to drop the STATMAN II name and am simply calling it MLT-2, or Material Label Tool 2nd generation since it does much more than labeling now.
Who knows? It might come in handy one day.
Update: I have added a page on the main site with a demo video and more information. See it here.
Readers might remember my previous article on counting methods and RFID where I promised to revisit this topic. Well, here we are.
Interest in using RFID for warehouse physical inventory management continues to be high. The technology is very attractive and it is not difficult to wonder why it has taken so long to adopt RFID at this level. Let’s explore the challenges:
Location, location, location. This remains an elusive problem. Using RFID to locate items down to the bin level is difficult, not necessarily because of technology limitations but mostly due to the laws of physics. There are schemes to overcome these issues, such as smart bins, triangulation, etc. but these don’t scale well and are usually cost-prohibitive. See Bouet & Dos Santos (2008) for further reading.
Business uses. In a warehouse, we perform just a handful of basic operations: receiving, shipping, putting items away, picking items, and counting items. RFID shines when items are moving, such as cars through a toll plaza, passengers at an airport, etc. Therefore, it is no surprise that RFID does well in shipping and receiving operations at distribution centers, under proper conditions. But this is what we call “pallet level” tracking. In this article we are talking about bin-level tracking of individual product units in the warehouse. Picking and putting material away already require personnel to physically contact the items, so RFID does not solve any business problem there. That leaves physical inventory as the only potential area of opportunity, and making a large investment in RFID to improve one transaction area may not make the best business sense. It is difficult to find a paper in this area that does not sound like a sales pitch, but for further reading give Hackenbroich, G., Bornhövd, C., Haller, S., & Schaper, J. (2006) a try.
Technical. I cannot ignore technical challenges in this article, but let me concentrate on what I call business-technical decisions. For example, the data that is associated with each tag, interfacing systems, tag design strategy, integration of technology with business practices and rules. I would argue that this is the most critical part of any RFID implementation project. Those technical decisions can have a drastic impact on business and operations. There are many papers written on this subject, but many are full of bias toward specific vendors or technologies, so a safe source is the RFID Wikipedia page.
Workload impact. After the business-technical decisions are made, we need to consider impact on workload and productivity. In order for RFID to work for us, we would need every single unit to be tagged. Tags have to be printed/recorded, the data associated with each individual tag needs to be entered in a system, and the tag has to be physically affixed to each individual item. Let me stress that we do not mean that, if we have 10 units of a product, we would generate 10 duplicate tags – no, it is much worse, we would generate an individual tag for each unit. In other words, each tag needs to be unique if we hope to use RFID for counting. This is where some people bring up the fact that many tags have a “license plate” that already makes them unique – what that argument ignores is that each tag identifier still needs to be associated to each item being tagged. In contrast, this is never the case with barcode labels so, no matter how we slice it, we would be doing more work. Do we want our receiving process to take all that additional time and effort? Good time for a business case analysis. Does the benefit outweigh the impact? I had mentioned Daniel Hellström in one of my earlier articles, and he has a good case study that applies to this topic, see Hellström, D., & Wiberg, M. (2010). Perhaps one of the most prolific authors on the subject is Gary Gaulker; see his paper from 2010 for a good example of his work related to this topic.
Regulations. As you might have guessed, my belief is that the principal benefit of RFID in retail warehouse operations is in physical inventory support, albeit with the known challenges about location and up-front workload. However, regulations might not even allow us to do that. Current DoD rules are not specific enough, though that may be about to change, on what constitutes a “physical count” but some auditing standards an accounting policy make it more obvious that it means human observation. So, for physical inventories that support some regulatory compliance, and unless we are talking about very short range RFID, it appears that RFID is not an option for inventory accountability until the rules specifically allow it.
This article is only a superficial discussion of the many issues facing RFID adoption for DoD warehouse physical inventory management. There are likely more areas that can be included. As usual, the issues are not all technological. Much more analysis needs to be conducted on the potential for business re-conceptualization in DoD enabled by RFID technology; until then, RFID will remain a technological solution looking for a business problem.
References
Bouet, M., & Dos Santos, A. L. (2008, November). RFID tags: Positioning principles and localization techniques. In Wireless Days, 2008. WD’08. 1st IFIP (pp. 1-5). IEEE.
Gaukler, G. M. (2011). Item-level RFID in a retail supply chain with stock-out-based substitution. IEEE Transactions on Industrial Informatics, 7(2), 362-370.
Hackenbroich, G., Bornhövd, C., Haller, S., & Schaper, J. (2006). Optimizing business processes by automatic data acquisition: RFID technology and beyond. In Ubiquitous and pervasive commerce (pp. 33-51). Springer, London.
Hellström, D., & Wiberg, M. (2010). Improving inventory accuracy using RFID technology: a case study. Assembly Automation, 30(4), 345-351.


